
Predicting Industry Economic Activity
Published:
In this post I discuss whether there is useful information contained in industry-specific credit spreads for predicting economic activity.
A long line of work in the macroeconomic forecasting literature has tested a range of financial variables that have predictive power for economic activity; (See, Friedman1993b, Estrella1991, Gertler2000, Gilchrist2012, Lopez-Salido2017, Mueller2009), but they have typically focused on aggregate data. Saunders et. al 2024 also established that the aggregate loan spread has predictive power for aggregate economic activity above and beyond information contained in bond spreads. But what has been less explored, is if industry-specific loan spreads can predict industry-level economic activity above and beyond information contained in aggregate spreads. I argue the process of aggregating data could obscure useful information for three key reasons.
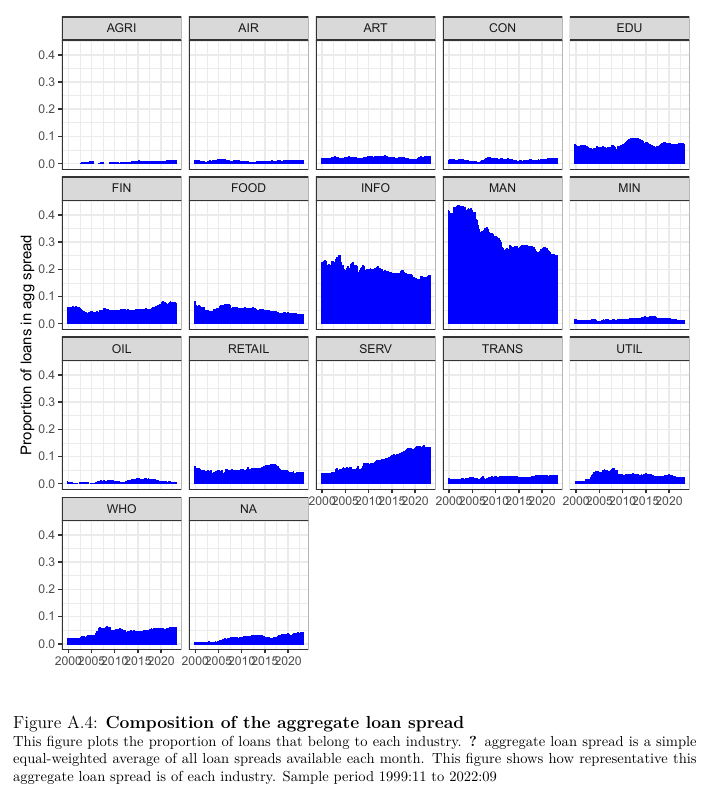
First, it could be that certain industries are over (or under)-represented in aggregate asset price indexes relative to their true economic contribution. For example, an aggregate loan index (either equal or value-weighted) will place more weight on industries which have more loans outstanding. The figure below plots the sectoral composition of loans and highlights that manufacturing (MAN) and information technology (INFO) have a disproportionate number of loans outstanding relative to other industries. Patterns in MAN and INFO loans spreads will, therefore, have a disproportionate impact on the aggregate loan spread. When compared to the economic contribution of each industry to total gross output (TGO), it is finance (FIN), manufacturing (MAN) and service (SERV) contributing the most to TGO. Therefore, aggregate loan spreads place more weight on industries with more loans outstanding, rather than industries which contribute more to economic activity.
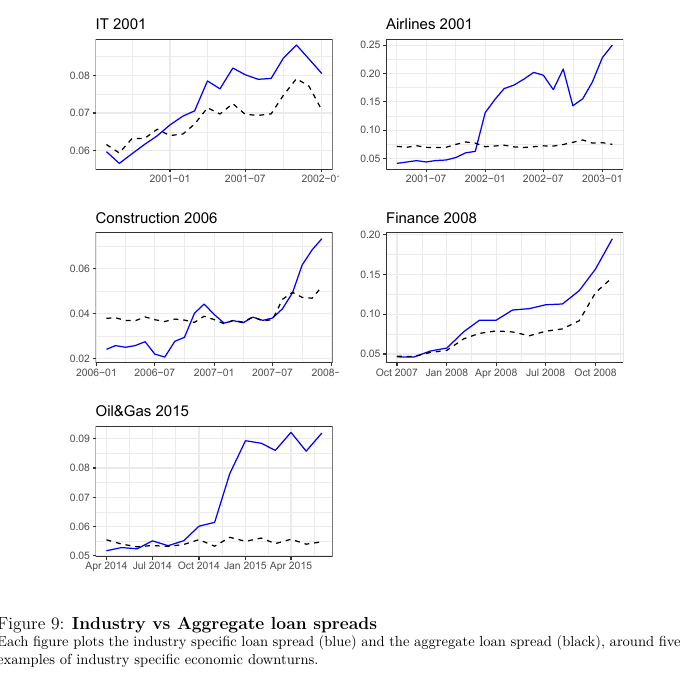
Second, it could be that sectoral shocks are more common than aggregate shocks, and these sectoral shocks would be obscured in aggregate indexes. The figure below highlights recent examples of industry level shocks. The 2001 recession which had its beginnings in the Dot-Com bust, the 2008/9 Global Financial Crisis which had its beginnings in a construction boom, and finally the 2015 Oil-Gas industry collapse following the collapse in the oil price. The blue line indicates the loan spread for the given industry and the black line the aggregate loan spread. This figure reveals that industry specific loan spreads reacted relatively early compared to the loan spreads in other industries around industry-specific shocks. These examples suggests that disaggregated industry level data provided a useful signal about the emerging risks in these particular sectors.
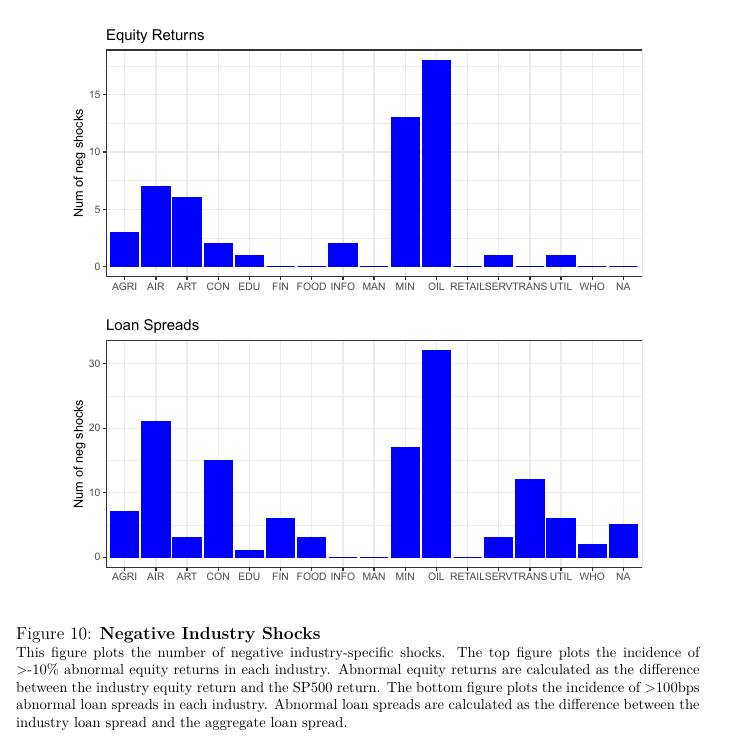
To provide statistics on the incidence of industry-specific shocks, I define a negative shock at the industry level by counting the number of episodes in which the abnormal equity return of an industry is lower than -10%. I define the abnormal return as the industry equity return minus the SP500 return in a given month. The figure below, top panel, highlights there are 52 (industry-month observations) where abnormal equity returns were lower than -10%. Alternatively, I use a 100bps abnormal increase in industry loan spreads as a negative shock. I define the abnormal loan spread as the change in industry loan spread minus the change in aggregate loan spread in a given month. The bottom panel, highlights there are 134 incidences where abnormal industry loan spreads were greater than 100bps. The incidence of negative shocks are more prevalent in certain industries such as ART, AIR, MIN, OIL. Given the frequency of industry-specific shocks, aggregate data may ignore useful signals about emerging risks in the economy.
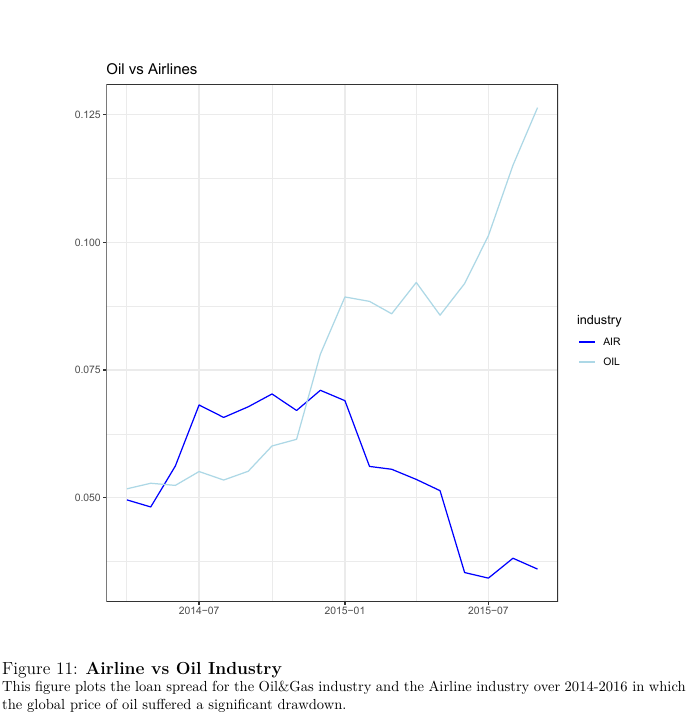
Third, not all economic shocks are equal. Some shocks affect all industries in the same direction, some affect industries in offsetting directions. For example, the Oil-Gas shock of 2015, was a negative shock for those firms directly linked to the extraction of oil. However, for industries for which energy is a significant input, this same shock was a positive shock. The figure below contrasts the loans spread for the oil and airlines industry. It is apparent the significant drop in oil prices, while negative for one industry, was positive for the other. This example highlights that different types of industry shocks may cancel out in the aggregate.
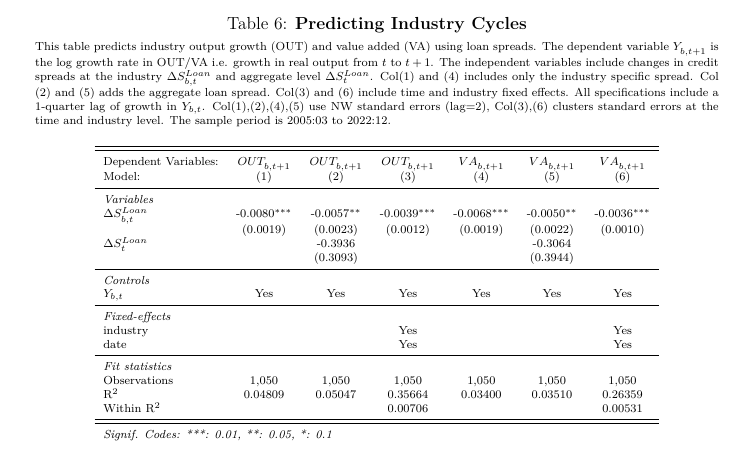
Given the reasons outlined above, I test whether industry-specific loans spreads contain information that is useful for predicting industry developments, beyond any information contained in the aggregate macroeconomic variables. I adopt the standard forecasting regression framework:
\[y_{b,t} = \beta_{0} + \beta_{1} \Delta S_{b,t} + \beta_{2} \Delta S_{t} + \epsilon_{b,t}\]where the dependent variable, \(y\), is either the 1 quarter-ahead growth rate in industry TGO or VA, i.e., the log growth rate in activity from \(t\) to \(t+1\). \(\Delta S_{b,t}\) is the change in industry loan spread from \(t-1\) to \(t\). \(\Delta S_{t}\) is the change in the aggregate loan spread from \(t-1\) to \(t\). All specifications also include one lag of the dependent variable and time or industry fixed effects, depending on the specification.
The table below summarises the baseline result. In column 1 I include only the industry loan spread and find an increase in industry specific loan spreads is associated with a decrease in the growth rate of industry specific output in the next quarter, i.e. a 100bps increase in the industry loan spread is associated with a 8 bps decrease in TGO next quarter. This is statistically and economically significant compared to the unconditional average of 47 bps in TGO growth over the next quarter. To test whether there is additional information in the industry level loan spreads, column 2 includes the aggregate loan spread. The coefficient on the industry spread remains negative and significant. Finally, column 3 includes industry and time fixed effects to absorb any common time trends. Column 4-6 repeat the same set of regressions but use industry VA as the dependent variable. Together, the table suggests industry specific loan spreads contain useful information for predicting industry level economic activity. The results are agnostic as to which component of credit spreads is reacting early. Credit spreads could change because investors are forecasting a deterioration in borrower health, or it might be that risk premia increase. However, given that not all industry spreads are changing simultaneously, this is more consistent with changes in borrower health, than changes in broad investor risk aversion.
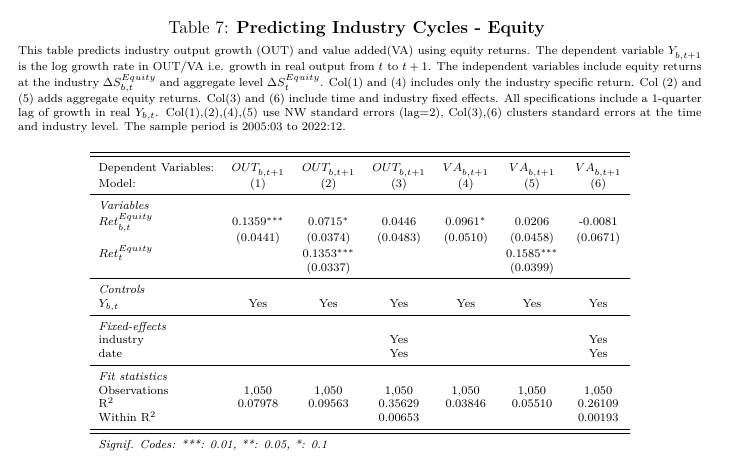
One may argue that equity markets, being larger and more liquid, should also contain useful information about predicting industry economic activity. Therefore in the table below, I test the ability of industry equity returns to predict industry economic activity. I repeat the specification used in the previous table, except replacing loan spreads with equity returns. Column 1/2 (4/5) suggest that an increase in equity returns predicts an increase in TGO (VA) in the next quarter. However, note that in column 2 and 5, once controlling for aggregate equity returns (i.e. returns on the SP500), the power of industry equity returns is substantially reduced. Furthermore, with the addition of fixed effects in column 3 and 6, the statistical significance disappears. This suggests that industry specific equity returns do not contain much additional information for forecasting industry level activity beyond the market return.
What is the benefit of using industry level loan spreads and who would find these results useful? First, policy makers would benefit from tracking industry level spreads to obtain a better understanding of the state of the economy. Furthermore, industry spreads may provide insights into the transmission mechanisms of monetary policy by tracking conditions in interest rate sensitive sectors. Second, bank loan officers would be a user of industry information given their role in allocating credit. For example, Blickle et. al (2023) show that loan portfolios of banks do show a tendency to specialise in certain industries. Industry credit spreads would provide loan officers with an additional barometer of conditions in each industry.